Debugging
This API is available since Fedify 2.0.0.
When developing a federated server app, it can be difficult to understand what activities are being sent and received, and whether signatures are being verified correctly. The @fedify/debugger package provides an embedded real-time debug dashboard that you can add to your app to inspect ActivityPub traces and activities without leaving your browser.
Installation
deno add jsr:@fedify/debuggernpm install @fedify/debuggerpnpm add @fedify/debuggeryarn add @fedify/debuggerbun add @fedify/debuggerSetup
The debugger works as a proxy that wraps your existing Federation object. It intercepts HTTP requests matching a configurable path prefix and serves the debug dashboard, while delegating everything else to the inner federation.
The simplest way to set it up is to call createFederationDebugger() with your federation object:
import { createFederation, MemoryKvStore } from "@fedify/fedify";
import { createFederationDebugger } from "@fedify/debugger";

const innerFederation = createFederation<void>({
  kv: new MemoryKvStore(),
  // ... other federation options
});

const federation = createFederationDebugger(innerFederation);
When called without an exporter option, createFederationDebugger() automatically:
- Creates a
MemoryKvStoreandFedifySpanExporterfor trace data storage - Creates a
BasicTracerProviderwith aSimpleSpanProcessor - Registers it as the global OpenTelemetry tracer provider
- Registers an
AsyncLocalStorageContextManageras the global OpenTelemetry context manager (required for parent–child span propagation) - Registers a
W3CTraceContextPropagatoras the global OpenTelemetry propagator (required for trace context to propagate across message queue boundaries) - Configures LogTape to collect logs per trace (using
getConfig()to merge with any existing configuration)
This means createFederation() will automatically use the tracer provider without needing an explicit tracerProvider option, and logs emitted by Fedify will be captured and displayed alongside traces in the dashboard.
The federation object returned by createFederationDebugger() is a drop-in replacement for the original. You can use it everywhere you would normally use the inner federation object (e.g., passing it to framework integrations).
WARNING
The debug dashboard is intended for development use only. It is strongly recommended to enable authentication if the dashboard is accessible over a network, as it exposes internal trace data.
Configuration
The createFederationDebugger() function accepts the following options:
path
The path prefix for the debug dashboard. Defaults to "/__debug__". All dashboard routes are served under this prefix.
For example, if you set path to "/_debug", the dashboard will be available at /_debug/ and traces at /_debug/traces/:traceId.
const federation = createFederationDebugger(innerFederation, {
  path: "/_debug",
});
auth
Optional. Authentication configuration for the debug dashboard. When omitted, the dashboard is accessible without authentication.
The auth option accepts a discriminated union with three modes:
Password-only authentication
Shows a login form with a single password field. You can provide a static password string or an authenticate() callback:
// Static password:
const federation = createFederationDebugger(innerFederation, {
  auth: {
    type: "password",
    password: Deno.env.get("DEBUG_PASSWORD")!,
  },
});
// Callback:
const federation = createFederationDebugger(innerFederation, {
auth: {
type: "password",
authenticate: (password) => password === "my-secret",
},
});Username + password authentication
Shows a login form with both username and password fields:
// Static credentials:
const federation = createFederationDebugger(innerFederation, {
  auth: {
    type: "usernamePassword",
    username: "admin",
    password: Deno.env.get("DEBUG_PASSWORD")!,
  },
});
// Callback:
const federation = createFederationDebugger(innerFederation, {
auth: {
type: "usernamePassword",
authenticate: (username, password) =>
username === "admin" && password === "secret",
},
});Request-based authentication
Authenticates based on the incoming Request object, without showing a login form. Useful for IP-based access control. Rejected requests receive a 403 Forbidden response.
const federation = createFederationDebugger(innerFederation, {
  auth: {
    type: "request",
    authenticate: (request) => {
      // Only allow requests from localhost
      const url = new URL(request.url);
      return url.hostname === "127.0.0.1" || url.hostname === "::1";
    },
  },
});
NOTE
Authentication only applies to the debug dashboard routes. All other requests (e.g., ActivityPub endpoints) are passed through to the inner federation without any authentication check.
exporter
Optional. A FedifySpanExporter instance that the dashboard queries for trace data.
When omitted (the recommended approach), the debugger automatically creates an exporter and sets up OpenTelemetry tracing for you.
When provided, you are responsible for setting up the BasicTracerProvider and passing it to createFederation(). See the Advanced setup section below.
kv
Required when exporter is provided. A KvStore instance used to persist log records collected by the debug dashboard's LogTape sink.
When using the simplified overload (without exporter), the debugger automatically creates a MemoryKvStore for log storage.
When using the advanced overload (with exporter), you must pass the same KvStore instance so that log records written by worker processes are visible in the web dashboard.
Dashboard pages
Once set up, the debug dashboard is accessible at the configured path prefix (default: /__debug__/).
Traces list
The root page (/__debug__/) shows a list of all captured traces. For each trace, it displays:
- Trace ID (first 8 characters, linked to the detail page)
- Activity types present in the trace (e.g., Create, Follow, Like)
- Activity count
- Timestamp
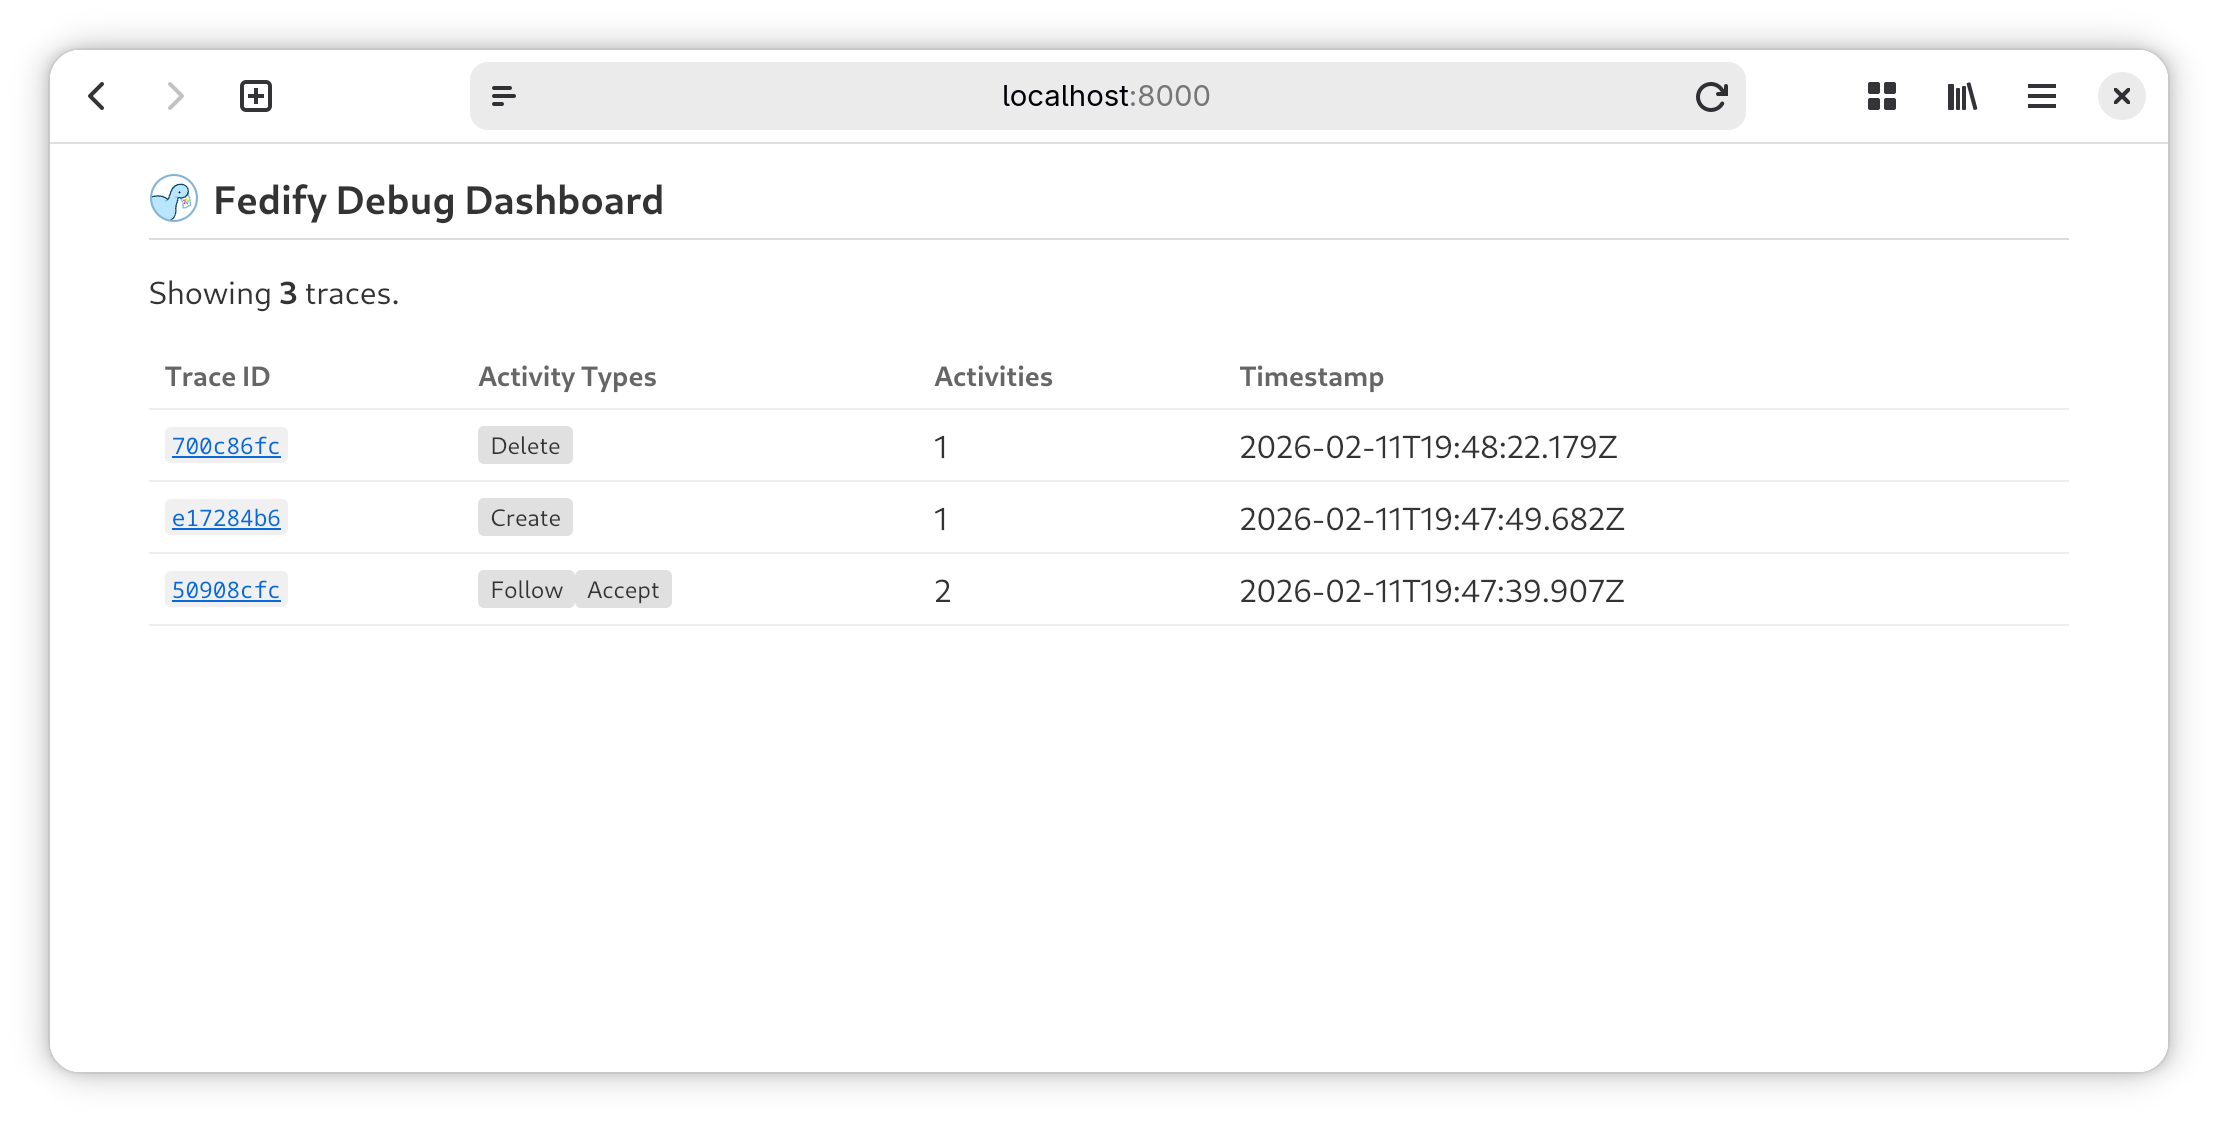
The page automatically polls the JSON API every 3 seconds and refreshes when new traces are detected.
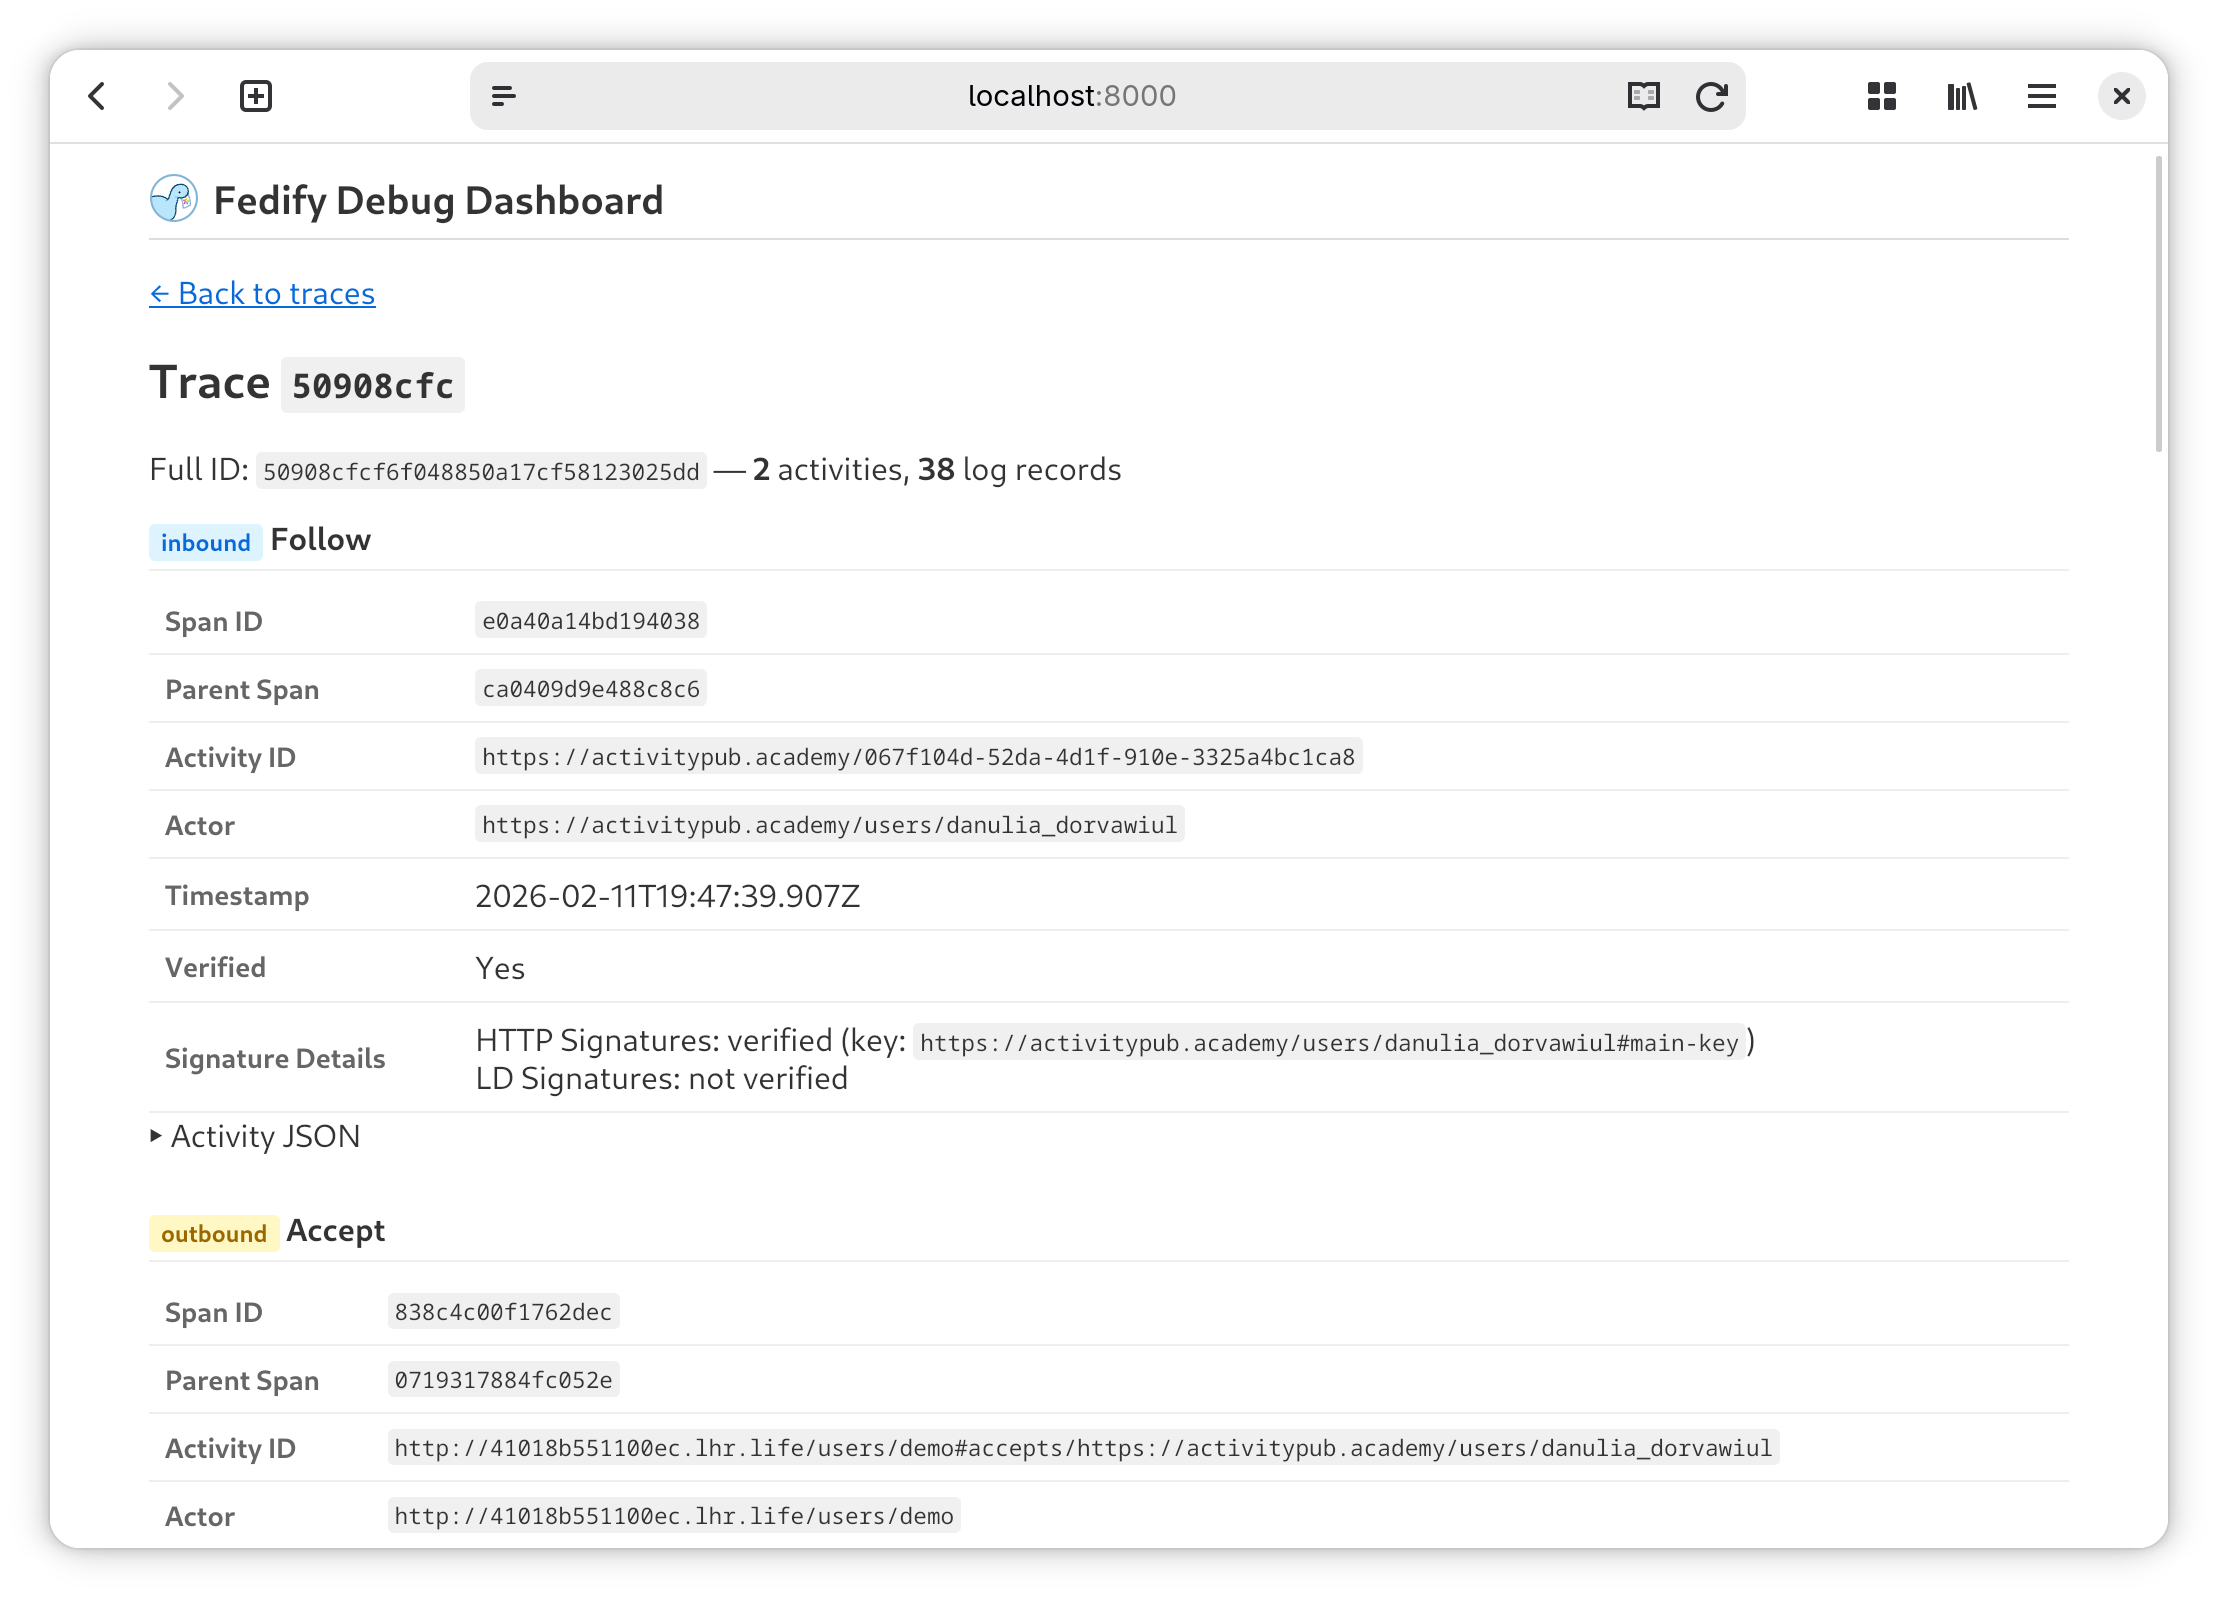
Trace detail
The trace detail page (/__debug__/traces/:traceId) shows all activities belonging to a specific trace. For each activity, it displays:
- Direction (inbound or outbound)
- Activity type (e.g., Create, Accept, Follow)
- Span ID and optional parent span ID
- Activity ID (if present)
- Actor ID
- Timestamp
- Inbox URL (for outbound activities)
- Signature verification details (for inbound activities):
- Whether HTTP Signatures were verified
- The key ID used for verification
- Whether Linked Data Signatures were verified
- Activity JSON (expandable, pretty-printed)
Below the activities section, a Logs section shows all LogTape log records captured during the trace. Each log entry displays:
- Timestamp (time portion only)
- Log level (color-coded: debug, info, warning, error, fatal)
- Logger category (e.g.,
fedify.federation.http) - Message with expandable properties
JSON API
A JSON API endpoint is available at /__debug__/api/traces which returns the list of recent traces in JSON format. This is used by the auto-polling mechanism on the traces list page, but you can also query it directly for programmatic access.
A separate endpoint at /__debug__/api/logs/:traceId returns the log records for a specific trace in JSON format.
Using with framework integrations
The debugger works with any framework integration that accepts a Federation object. Simply wrap the federation before passing it to your integration:
Hono
import { createFederation, MemoryKvStore } from "@fedify/fedify";
import { createFederationDebugger } from "@fedify/debugger";
import { federation as honoFederation } from "@fedify/hono";
import { Hono } from "hono";

const innerFederation = createFederation<void>({
  kv: new MemoryKvStore(),
});
const federation = createFederationDebugger(innerFederation);

const app = new Hono();
app.use(honoFederation(federation, (_) => undefined));
Express
import { createFederation, MemoryKvStore } from "@fedify/fedify";
import { createFederationDebugger } from "@fedify/debugger";
import { integrateFederation } from "@fedify/express";
import express from "express";

const innerFederation = createFederation<void>({
  kv: new MemoryKvStore(),
});
const federation = createFederationDebugger(innerFederation);

const app = express();
app.use(integrateFederation(federation, (req) => undefined));
Advanced setup
If you need full control over the OpenTelemetry setup (for example, to use a custom KvStore or to add additional span processors), you can pass an explicit exporter option:
import { createFederation, MemoryKvStore } from "@fedify/fedify";
import { FedifySpanExporter } from "@fedify/fedify/otel";
import { createFederationDebugger } from "@fedify/debugger";
import { context, propagation } from "@opentelemetry/api";
import { AsyncLocalStorageContextManager } from "@opentelemetry/context-async-hooks";
import { W3CTraceContextPropagator } from "@opentelemetry/core";
import {
  BasicTracerProvider,
  SimpleSpanProcessor,
} from "@opentelemetry/sdk-trace-base";

// Register context manager and propagator (required for trace
// propagation across async boundaries and message queues):
context.setGlobalContextManager(new AsyncLocalStorageContextManager());
propagation.setGlobalPropagator(new W3CTraceContextPropagator());

// Create a KV store and a span exporter that captures trace data:
const kv = new MemoryKvStore();
const exporter = new FedifySpanExporter(kv);
const tracerProvider = new BasicTracerProvider({
  spanProcessors: [new SimpleSpanProcessor(exporter)],
});

const innerFederation = createFederation({
  kv,
  tracerProvider,
  // ... other federation options
});

// Wrap the federation with the debugger:
const federation = createFederationDebugger(innerFederation, {
  exporter,
  kv,
});
In this mode, the returned federation object has a sink property that is a LogTape Sink function. You should include it in your LogTape configuration to enable per-trace log collection:
await configure({
  sinks: {
    debugger: federation.sink,
    // ... other sinks
  },
  loggers: [
    { category: "fedify", sinks: ["debugger"] },
    // ... other loggers
  ],
});
In this mode, you are responsible for:
- Registering an
AsyncLocalStorageContextManageras the global context manager - Registering a
W3CTraceContextPropagatoras the global propagator - Creating and configuring the
BasicTracerProvider - Passing
tracerProvidertocreateFederation() - Passing the same
exporterandkvtocreateFederationDebugger() - Configuring LogTape with
federation.sinkto collect logs per trace